1. Business Context
The European power grid is undergoing the most significant transformation in decades. As renewables expand, electricity markets face heightened price volatility — a signal of stress, inefficiency, or insufficient balancing infrastructure.
Volatility matters because it affects:
- Consumers (unstable bills erode public trust in the transition).
- Utilities & Grid Operators (difficulty in forecasting).
- Policymakers & Advocacy Groups (need for evidence-based lobbying to accelerate investments).
For stakeholders and political green parties, robust evidence is needed to lobby conservative policymakers. The business question becomes:
👉 How has daily electricity price volatility evolved across Europe from 2016–2024, and what does this reveal about system resilience during the energy transition?
2. Defining the Technical Core
Key Performance Indicators (KPIs):
- Daily Standard Deviation (daily_std): Spread of hourly prices from the daily mean.
- Daily Range (daily_range): Max–min difference within each day.
Both measure unpredictability but appeal to different stakeholders:
- Standard deviation → statistically rigorous (for analysts, regulators).
- Range → intuitive (for policymakers, lobbyists).
Terminology Simplified:
- ENTSO-E: Central EU electricity data hub.
- Bidding Zones: Market regions (country or sub-country).
- PT60M: Hourly resolution dataset, ensuring granularity.
- €/MWh: Standard price unit.
3. Methodological Flow (Data Pipeline)
- Data Acquisition & Prep: Automated Python pipeline extracting 122 ENTSO-E files → reproducible dataset.
- Processing: Filtering for 2016–2024, hourly granularity → KPIs by date & zone.
- Analysis: Regional, temporal, and pan-European comparisons.
- Visualization & Reporting: Plots, bar charts, and rankings for decision-maker readability.
BA’s Role: Ensuring metrics align with advocacy needs, shaping technical outputs into policy-relevant evidence.
4. Analytical Insights (2016–2024 Findings)
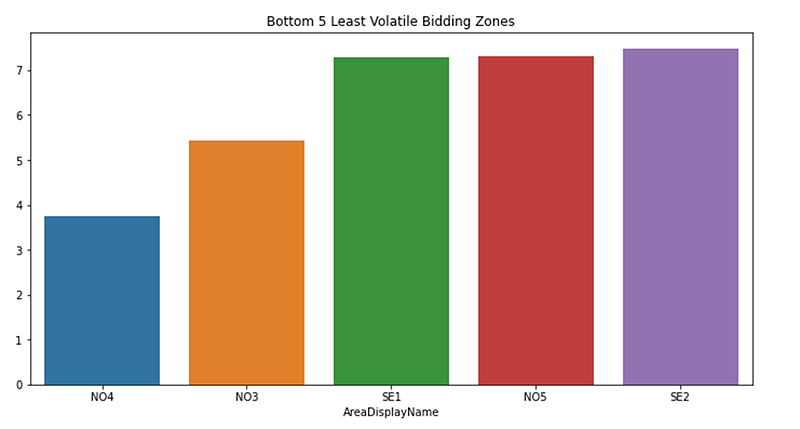
🔹 Regional Disparities
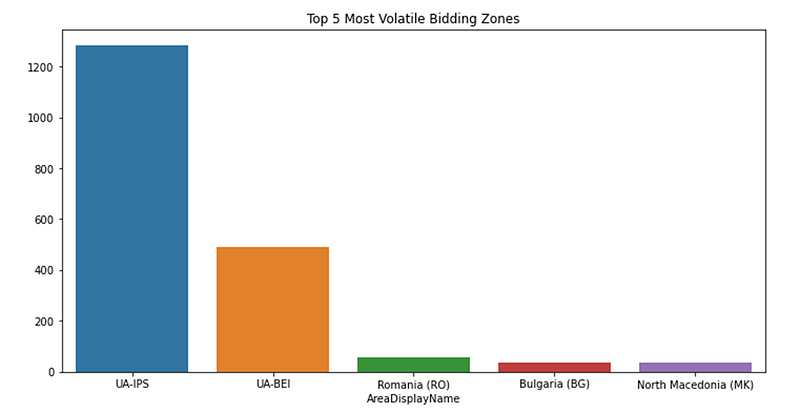
- High Volatility Zones: Ukraine (UA-IPS, ~€2007/std), Romania, Hungary, Bulgaria → market fragility, geopolitics, and weaker grid integration.
- Low Volatility Zones: Norway & Sweden (hydropower-driven stability).
➡ Business Insight: Hydropower acts as a natural stabilizer. Eastern Europe’s volatility signals systemic vulnerabilities.
🔹 Seasonal & Structural Trends
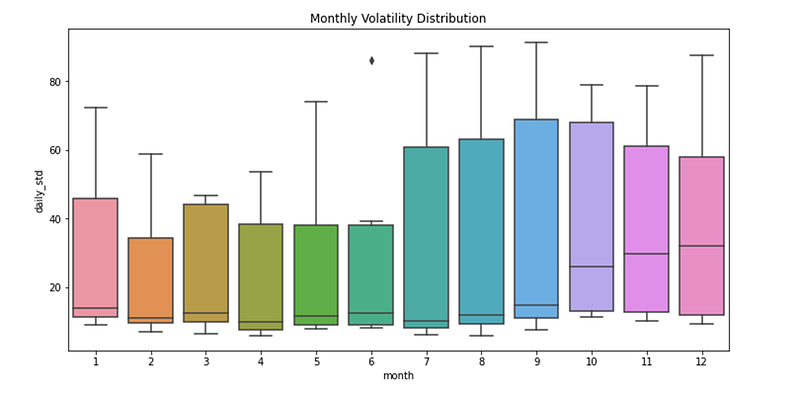
Summary of Boxplot Interpretation
The boxplot depicts aggregated, Europe-wide seasonal patterns in day-ahead electricity price volatility (measured as average monthly daily standard deviation) across all ENTSO-E bidding zones from 2016–2024, influenced by continent-wide factors such as weather, demand cycles, renewable energy integration, and geopolitical events.
Key Trends and Insights
- Overall Seasonal Pattern: Volatility is lower and more stable in the first half of the year (months 1–5, medians 30–45), then rises in the second half (months 6–12, medians ~50–70), peaking in August-September (65–70) with the widest interquartile ranges (IQRs), indicating greater year-to-year variability and higher averages during late summer/early fall. It slightly decreases toward year-end. This aligns with higher spring/summer volatility driven by renewable energy surpluses (e.g., solar and wind leading to frequent negative prices and fluctuations, especially on weekends with low demand), contrasting with more predictable winter demand peaks from heating.
Month-by-Month Variability:
- Low-Volatility Months: January (median ~45, but with a prominent high outlier); February-March (medians ~35–40, narrower boxes for consistency).
- Increasing Trend: From April onward, boxes widen (greater IQR), reflecting rising variability, with peaks in August-September.
- High-Variability Months: July and October show long whiskers, signaling extreme highs/lows in certain years.
- Outliers and Anomalies: Outliers, such as the high January value (~90), likely stem from specific events like the 2017 cold snap (combined with French nuclear outages) or early 2022 energy crisis tensions (pre-invasion gas supply fears and record highs)
- Broader volatility spikes post-2021 (e.g., 2022 peaks) tie to the Russia-Ukraine war, gas shortages, and pandemics, amplifying seasonal effects.
- Data Considerations: Each box summarizes ~9 data points (annual averages per month), a small sample explaining narrower (consistent) vs. wider (variable) boxes.
This visualization highlights seasonality potentially exacerbated by the energy transition (e.g., intermittent renewables increasing summer volatility) and external shocks, with implications for market stability.
- Winter & Summer spikes visible, aligning with demand surges.
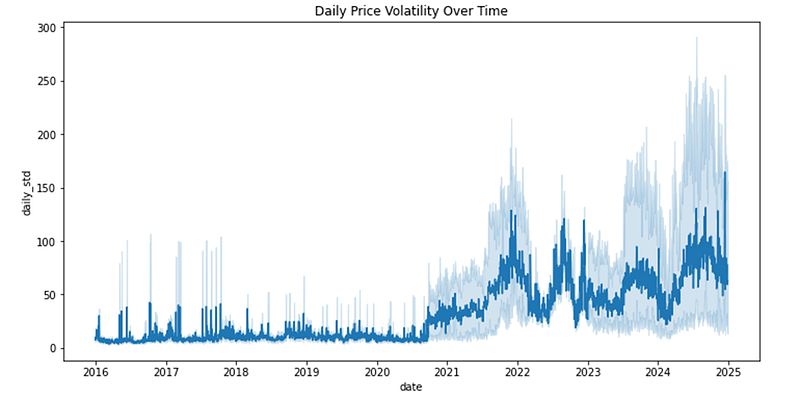
- Long-term trend: Volatility rising in many zones → correlated with growing renewable penetration and insufficient grid balancing/storage.
➡ Business Insight: The transition is increasing pressure on traditional market designs.
🔹 European Aggregates
A pan-European volatility index shows a gradual upward drift, highlighting systemic risks.
➡ Advocacy Opportunity: Positioning volatility as a European-wide challenge, not just regional.
5. Business Value & Advocacy Leverage
- Risk Identification: Target regions (Eastern Europe, war-affected zones) where volatility undermines stability.
- Performance Benchmarking: Use Nordic hydro stability as a policy case study.
- Evidence for Lobbying: Green parties can demonstrate that renewables with proper infrastructure reduce volatility, while fossil reliance/geopolitical risk increases it.
- Narrative Shift: Conservatives may resist subsidies for renewables, but data shows investments in grid storage & interconnections lower volatility, reducing long-term market risks and taxpayer exposure.
6. Next Steps for Analysis
- Correlation Analysis: Match volatility with renewables share, weather data, and fossil fuel price swings.
- Policy Overlay: Identify regulatory designs linked to stable/unstable outcomes.
- Early Warning Index: Develop a European Electricity Stability Index to influence discourse quarterly.
7. Political & Market Implications
Green parties can leverage this evidence to frame volatility as a cost of inaction:
- Conservatives: Position renewable investments as market stabilizers and tax-reducing in the long run.
- Policymakers: Justify storage and interconnection projects with data-backed arguments.
- Investors: Highlight volatility trends as risk signals — pushing capital into renewables and flexible assets.
Conclusion:
Electricity price volatility is not just a statistical metric. It’s a business KPI for Europe’s energy transition. With evidence-based lobbying, volatility analysis becomes a powerful tool to align political narratives, reduce grid risks, and accelerate renewables adoption.